California’s Education Paradox: More Money, Worse Results
California has managed to spend 34% more per student since 2019, yet fewer of them can read and do math at grade level.

TL;DR
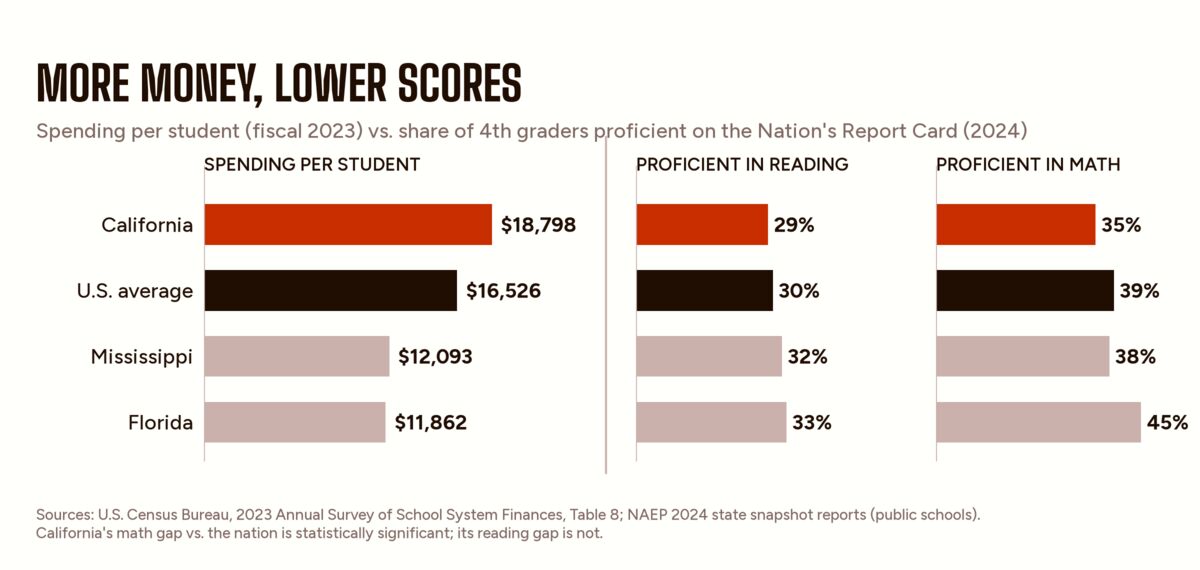
California spent $18,798 per student in fiscal 2023, 14% above the national average. Its 4th graders scored below the national average in math, no better than average in reading, and below several states that spend far less. Only 7% of California’s Black 4th graders read proficiently. From 2018–19 to 2022–23, per-student spending rose 34% while the share of students meeting state standards fell. From 2014 to 2022, California schools lost 382,000 students and added 41,000 non-teaching staff.
What California spends
- Total. The 2025–26 state budget puts TK–12 funding from all sources at $137.6 billion, about $25,155 per student.
- Day-to-day spending. On the Census Bureau’s standard measure, California spent $18,798 per student in fiscal 2023. That is 14% above the U.S. average of $16,526 and ranks 15th of 50 states.
What lower-spending states are getting
Mississippi and Florida spend about $6,700 to $6,900 less per student than California. Both changed how they teach reading. Mississippi’s 2013 literacy law required phonics-based instruction, reading coaches for teachers, and extra help and possible retention for 3rd graders who can’t read. Florida made similar changes starting in 2002. Results from the 2024 Nation’s Report Card:
- 4th grade reading. Mississippi 219, California 212 (average scores). The national average was 214.
- 4th grade math. Mississippi 239, California 233. The national average was 237. California scored below 31 states and jurisdictions.
- 8th grade. The two states scored about the same.
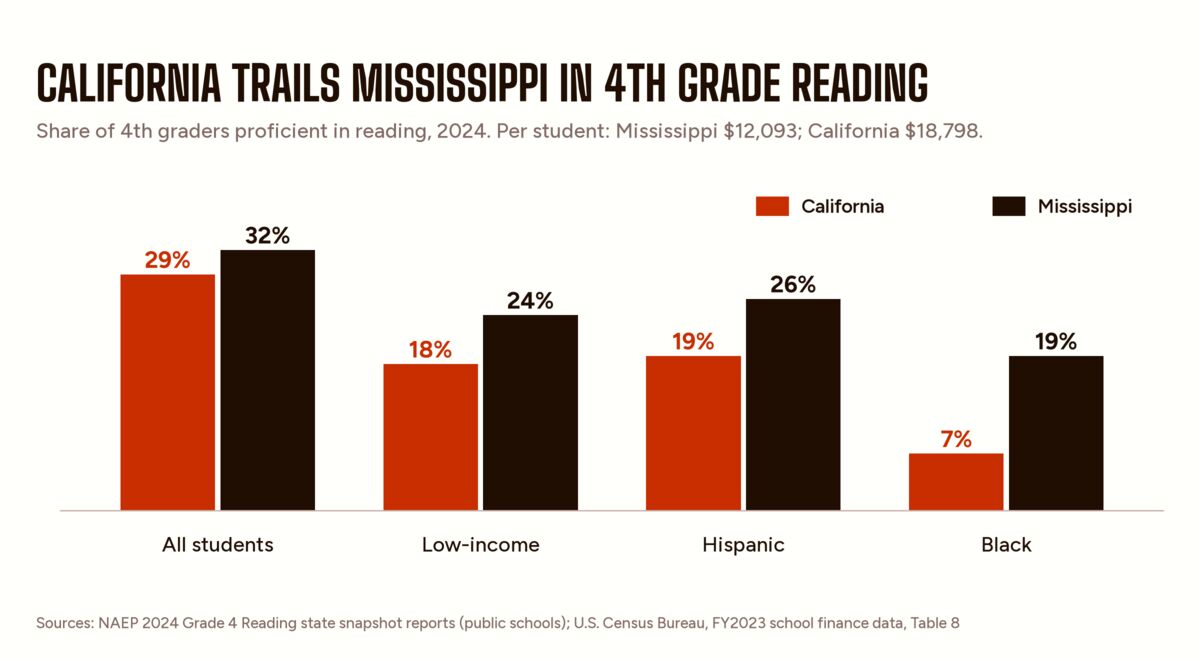
- Low-income 4th graders proficient in reading. Mississippi 24%, California 18%.
- Latino 4th graders. Mississippi 26%, Florida 31%, California 19%.
- Black 4th graders. Mississippi 19%, California 7%. In California, 72% scored below NAEP’s Basic level.
Spending vs. results
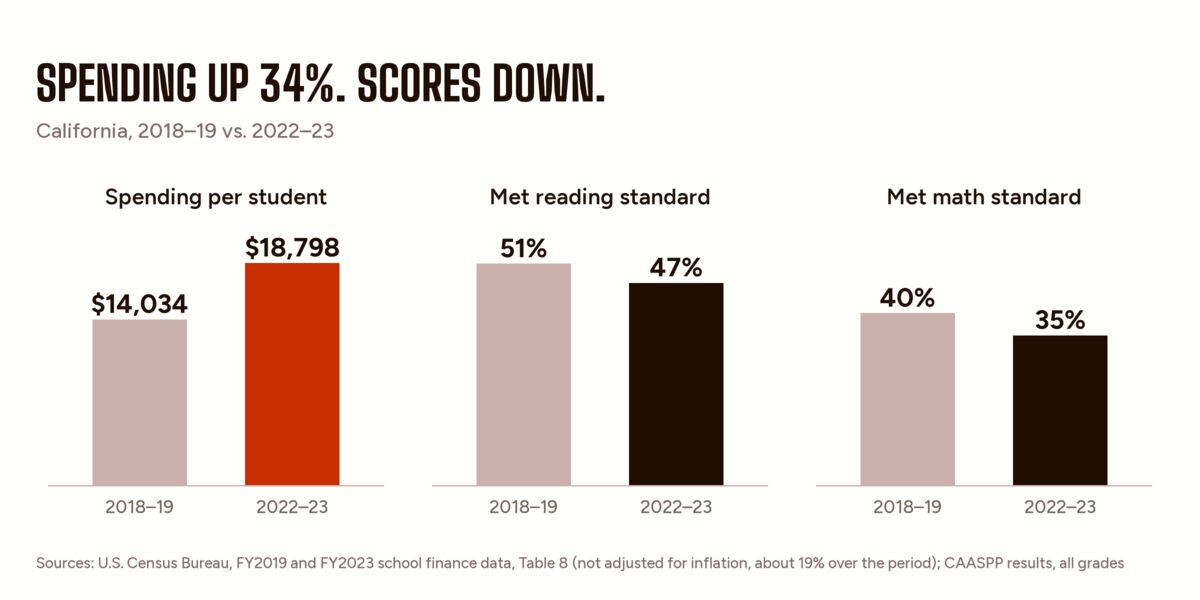
- Spending. Per-student spending rose from $14,034 in 2018–19 to $18,798 in 2022–23, up 34% (about 12% after inflation).
- Results. Over the same period, the share of students meeting the state reading standard fell from 51% to 47%, and math from 40% to 35%. In 2024–25 the figures were 48.8% and 37.3%. In 2025–26, under renamed achievement levels with the same cut scores, 49.3% and 38.4% scored proficient or advanced.
- 11th grade math. In 2024–25, 30.5% met the standard. 48.6% scored at the lowest level.
Where the money goes
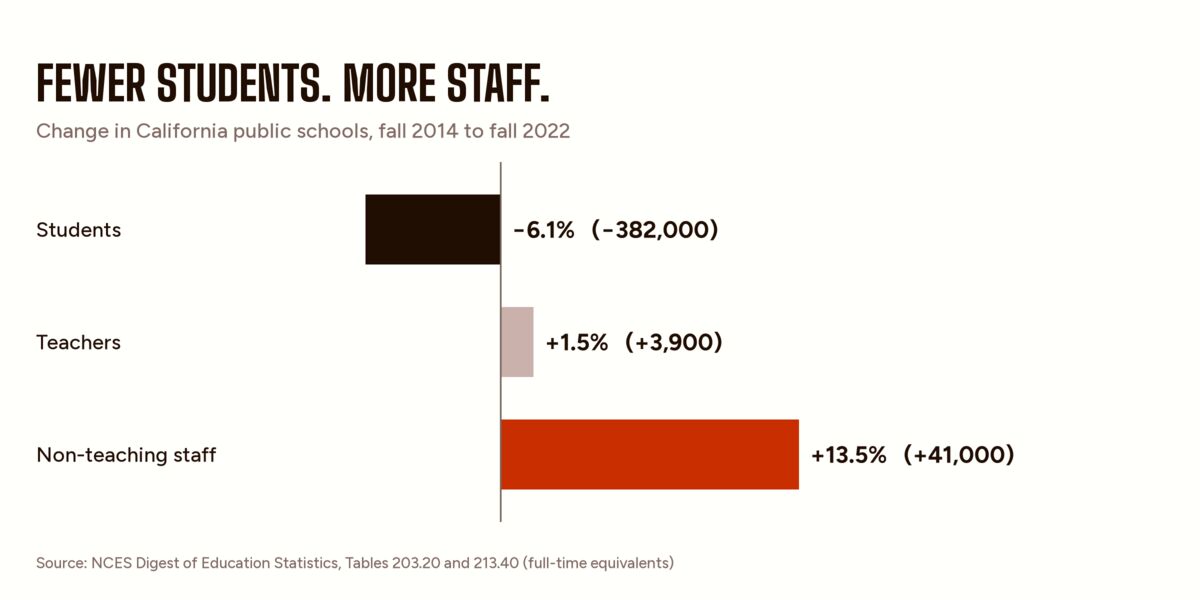
- Staff vs. students. From fall 2014 to fall 2022, California public school enrollment fell by 382,000 students (6.0%). Over the same period, schools added about 3,900 teachers (1.5%) and 41,000 non-teaching staff (13.5%).
- Administrators. From 2019–20 to 2023–24, the number of school administrators rose about 15%, from just over 25,000 to 28,780, while enrollment fell about 5%. Pupil services staff rose from about 30,000 to 36,535.
- Teachers’ share. Teachers made up 54% of California school staff in 2000 and 44% in 2022.
- San Francisco. A 2024 report by the city’s teachers union found SFUSD added 168 high-level administrative positions since 2009–10, at about $34 million a year, while enrollment fell. It found SFUSD spends $394 per student on central-office supervisors, compared with a state average of $201.
Fewer advanced classes
- San Francisco. SFUSD stopped offering Algebra I in 8th grade in 2014. According to the New York Times, enrollment in advanced high school math declined afterward and racial gaps remained. In 2024 the board voted 6–1 to begin restoring it, starting that fall at about a third of middle schools. In March 2026 it voted 4–3 to offer it at all middle schools starting in 2026–27.
- Palo Alto. In January 2025, the Palo Alto Unified board voted 3–2 to eliminate freshman Honors Biology and place all 9th graders in one course, starting in 2025–26.
- Statewide. Critics said the math framework the state adopted in July 2023 steered Algebra I to 9th grade. State Sen. Rosilicie Ochoa Bogh wrote SB 1410, signed into law in 2024, which requires the next framework to consider offering Algebra I to all 8th graders.
San Francisco: $22,880 per student
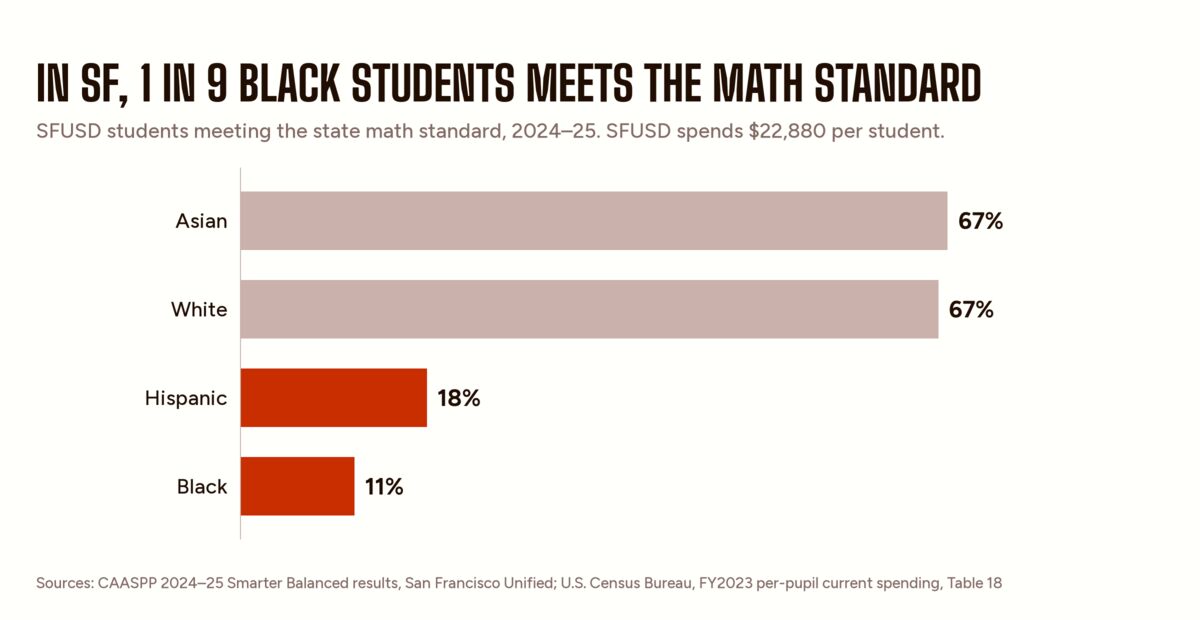
SFUSD spent $22,880 per student in fiscal 2023, 22% above the state average. Share meeting the state math standard, 2024–25:
- Black students. 10.9%. 72.7% scored at the lowest level. In reading, 19.4% met the standard.
- Latino students. 17.8%.
- White and Asian students. 66.5% and 67.4%.
- Elsewhere. Black students met the math standard at 13.5% in Oakland Unified, 20.1% statewide and 24.7% in Los Angeles Unified.
Reading
- 3rd grade. In 2024–25, 44.2% of California 3rd graders met the state reading standard. About a third scored at the lowest level.
- 4th grade. 44% scored below NAEP’s Basic level in reading, up from 42% in 2022. The national figure was 41%.
- Adults. 28% of California adults read at or below Level 1, the second-lowest of PIAAC’s literacy levels. That is tied for second-highest among states. The estimates draw on data collected in 2012, 2014 and 2017 and include adults still learning English.
Where it stands
- Algebra. Starting in fall 2026, SFUSD will offer 8th-grade Algebra I at every middle and K–8 school. The state’s next math framework must consider offering it statewide.
The bottom line
California spends $18,798 per student. That is $2,272 more than the national average and about $6,700 more than Mississippi. Per-student spending is up 34% since 2018–19. Since 2014, schools have added 41,000 non-teaching staff while enrollment fell by 382,000 students. Yet fewer than half of California students meet the state reading standard, fewer than 2 in 5 meet the math standard, and Mississippi now outscores California in 4th grade reading and math.
We’re spending more than ever, yet getting worse results. It’s time we start asking why.